BYD is the world’s best-selling EV brand in 2026, holding roughly 11–17% of global market share depending on how the count is done, with Tesla in second place and Volkswagen Group leading a fragmented European market. But global rankings hide a much messier story underneath: Tesla still dominates the United States with over half of all EV sales, BYD barely registers there, and in Europe, Chinese brands are gaining fast but still trail German and American incumbents. The “winner” of 2026 depends entirely on which market you’re standing in. Below, we break down brand-by-brand market share across the world’s three largest EV regions, plus the battery-supply battle running underneath all of it.
Quick Summary Box
- Global leader by volume: BYD, with global EV market share estimated between 11% (unit-based) and 17% (brand-inclusive estimates), depending on methodology.
- US leader: Tesla, commanding roughly 50–58% of US EV sales in 2026, even as its raw sales volume declined year-over-year.
- Europe leader: Volkswagen Group, holding around 25–28% group-level EV share; BYD has overtaken Tesla in European registrations every month of 2026 so far.
- Fastest riser: BYD and Chery-affiliated brands, with Chinese OEMs’ European share roughly doubling year-over-year in early 2026.
- Battery supply chain leader: CATL, controlling about 40% of global EV battery installations, more than double BYD’s own battery share.
Global EV Market Share in 2026: The Big Picture
The global EV market is bigger and more volatile than it’s ever been. <cite index=”2-1″>Global EV sales reached about 20.7 million units in 2025, roughly 20% higher than 2024</cite>, and <cite index=”2-1″>China still controls close to 80% of the battery supply chain while accounting for more than 60% of EV sales worldwide</cite>.
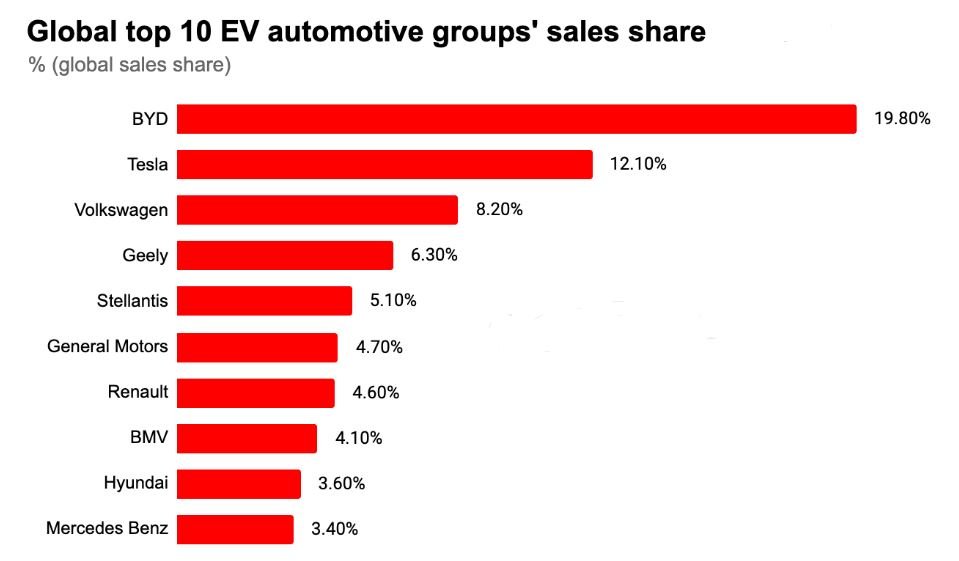
At the brand level, estimates vary depending on whether analysts count BEVs only, BEVs plus plug-in hybrids, or revenue instead of units. One widely cited estimate puts <cite index=”6-1″>BYD at 10.9% of global EV market share, followed by Tesla at 7.8%, Geely at 3.3%, Li Auto at 1.8%, and Xiaomi at 1.7%</cite>, with the remaining field split among dozens of smaller players. A separate volume-based estimate places BYD closer to 17% once its full BEV-plus-PHEV lineup is counted, underscoring how much the number moves depending on definitions.
What almost every dataset agrees on is the shape of the podium: BYD or Tesla in first, the other close behind, and Geely rising fastest of the challengers.
Revenue Tells a Different Story Than Volume
Selling the most cars doesn’t mean earning the most money. <cite index=”6-1″>The top ten EV companies deliver 47.8% of all global EVs but capture only 29.8% of global EV revenue</cite>, largely because <cite index=”6-1″>BYD’s average selling price sits around $20,300, versus roughly $41,300 for Tesla and $90,700 for Rivian</cite>. In other words, BYD wins on units, Tesla and premium Western brands win on margin per vehicle.
China: The Home-Field Advantage Nobody Can Match
China remains the anchor of BYD’s global lead, and the company’s dominance domestically has been reinforced by strong export growth. <cite index=”5-1″>BYD’s overseas exports surged 70% year-over-year in April 2026, setting a new monthly record</cite>. Yet even at home, BYD’s position isn’t uncontested — Xiaomi, Li Auto, NIO, and XPeng are all carving out share in adjacent segments, from budget hatchbacks to premium tech-forward SUVs.
Europe: Volkswagen Group Holds the Crown, BYD Closes the Gap
Europe is the region where legacy automakers are putting up the strongest fight. At the group level, <cite index=”9-1″>Volkswagen Group led with 25.1% share in April 2026</cite>, a figure <cite index=”9-1″>comparable to BYD’s dominance in China and Tesla’s in the US</cite>. At the individual brand level, <cite index=”10-1″>Volkswagen held a 9.7% market share in January 2026</cite>, ahead of BMW and BYD.
But the gap is closing fast. <cite index=”9-1″>Chinese OEMs’ combined European share rose 125% year-over-year in April 2026, reaching 9% of the market, up from 4% a year earlier</cite>. BYD in particular has flipped the script on Tesla: <cite index=”13-1″>BYD registered 135,307 vehicles across the EU, EFTA, and the UK in the first five months of 2026, giving it a 2.3% market share versus Tesla’s 2.0%</cite>, and <cite index=”13-1″>BYD has outsold Tesla in European registrations every single month of 2026 so far</cite>. Germany, historically Tesla and VW territory, has become a surprising BYD growth market: <cite index=”13-1″>BYD’s German registrations hit 26,264 units in the first half of 2026, up 318% year-over-year, already surpassing its full 2025 total</cite>.
Tesla itself has been inconsistent. <cite index=”8-1″>Volkswagen led Europe’s first quarter with 96,601 sales and an 8.9% share, though that share fell 2.2 percentage points year-on-year</cite>, while <cite index=”8-1″>Tesla posted a 45.4% sales increase to 78,642 units and a 7.3% share, up 0.9 percentage points year-on-year</cite> on the back of a strong March. By April, though, <cite index=”9-1″>Tesla’s share had slipped to 6%, dropping it to fourth place behind BMW</cite>.
Key European Trends to Watch
- Affordability is driving volume. Models like the Renault 5, VW ID.3, and Skoda Elroq are pulling EV adoption beyond premium buyers. <cite index=”14-1″>The Skoda Elroq has even outsold the Tesla Model Y in some markets like Denmark</cite>.
- BEV share overall is climbing. <cite index=”9-1″>Europe’s BEV segment jumped 42% year-over-year, reaching 23% of total car sales</cite> by mid-2026.
- Chery’s group of brands (Jaecoo, Omoda, Chery) posted some of the fastest growth of any Chinese entrant, <cite index=”9-1″>surging 322% year-over-year</cite>.
United States: Tesla’s Grip Tightens, Even as the Market Shrinks
The US tells the opposite story from Europe: Tesla isn’t losing ground, it’s consolidating it — but only because the entire market is contracting around it. The catalyst was the expiration of the federal EV tax credit at the end of September 2025.
<cite index=”18-1″>New EV sales fell 27% year-over-year in Q1 2026, to around 216,400 units, with EVs making up just 5.8% of all new-vehicle sales</cite> — down sharply from the 10.6% peak in Q3 2025. Non-Tesla brands absorbed almost all of that pain: <cite index=”21-1″>Tesla’s US EV market share climbed from 43.2% to 54.2% between Q4 2025 and Q1 2026</cite>, even though <cite index=”17-1″>Tesla’s own US sales fell 8.4% year-over-year to about 117,300 units in Q1</cite>, because <cite index=”21-1″>sales from every other manufacturer combined dropped roughly 41%</cite>.
By the first half of 2026, the picture had stabilized somewhat. <cite index=”20-1″>Tesla accounted for 50.5% of the roughly 463,000 EVs sold in the US in H1 2026</cite>, with <cite index=”20-1″>Q2 sales rebounding 14.7% from Q1</cite> as new models reached dealers. Behind Tesla, the field remains thin: <cite index=”16-1″>Cadillac, Volvo, Jeep, and Lucid were the only brands to post year-over-year gains</cite> through the credit expiration, while <cite index=”19-1″>Ford’s registrations dropped 67% and Chevrolet’s fell 55% in January 2026 alone</cite>.
BYD, for context, has essentially no US retail presence due to tariffs and import restrictions — a reminder that “global market share” and “your local market share” can be entirely different conversations.
The Hidden Layer: Battery Supply Market Share
Underneath brand-level competition sits the battery supply chain, where a smaller set of companies actually controls production capacity. <cite index=”3-1″>CATL held a 40.2% share of global EV battery installations across January–May 2026</cite>, more than <cite index=”3-1″>triple BYD’s own battery installation share, and up from 38.0% a year earlier</cite>. <cite index=”4-1″>The two Chinese battery giants combined controlled 54.3% of the global battery market</cite> as of April 2026. <cite index=”3-1″>Seven of the top ten global battery makers are Chinese firms, together accounting for 72.6% of the market</cite>, squeezing Japanese and South Korean suppliers like LG Energy Solution, which <cite index=”4-1″>saw its market share slip to 9.1% even as its total volume grew</cite>.
This matters for brand-level competition because it sets the cost floor: automakers sourcing from CATL or BYD’s battery arm generally access cheaper cells than those relying on LGES or Panasonic, which flows directly into vehicle pricing power.
Comparison Table: EV Brand Market Share by Region (2026)
| Brand | Global Share (Est.) | Europe Share | US Share | Regional Rank |
|---|---|---|---|---|
| BYD | ~11–17% | ~2.3–6.8% | Minimal (import limits) | #1 global, #3 Europe |
| Tesla | ~7.8% | ~6–7.3% | ~50–58% | #2 global, #1 US |
| Volkswagen Group | Not separately disclosed | ~25–28% | Limited BEV lineup | #1 Europe (group) |
| Geely Group | ~3.3% | Minor presence | Not present | #3 global |
| BMW Group | Not disclosed | ~7.1–10.2% | Niche | #2–3 Europe |
| Li Auto | ~1.8% | Minimal | Not present | Top 5 China-focused |
| Xiaomi | ~1.7% | Minimal | Not present | Fast-rising China entrant |
| Cadillac / GM (Equinox EV) | Not disclosed | Minor | Growing | Top 5 gainer in US |
Global brand-level share estimates vary significantly (11% vs. 17%) depending on whether PHEVs and export-only sub-brands are included. Treat as directional, not precise.
Bottom Line
BYD is the closest thing to a global EV champion in 2026, but “winning” looks different depending on the map: Tesla still owns America, Volkswagen Group still owns Europe at the group level, and BYD’s real story is how fast it’s converting momentum into share everywhere except the US, where tariffs keep it locked out. If there’s one brand to watch through the rest of 2026, it’s BYD in Europe — its month-over-month gains against Tesla are the fastest shift in market share this industry has seen in years.